

PythonPro #7: Unleash Mojo's Speed, Secure Your Python, and Master One-Liners! 🚀🐍
Elevate your Python game with bite-sized actionable content, practical tutorials, news, and Expert Insights

“There's a popular programming trope that if the solution to your problem involves parsing text with a regular expression, you now have two problems…However, others might think a bit harder and wonder "what if I did something so audacious that it resulted in three problems?"”
— David Beazley (2023), Now You Have Three Problems
How many problems and solutions do you have? Welcome to a brand new issue of PythonPro!
ChatGPT's Python code whiz has opened the door to endless possibilities, but – there's a sneaky security hiccup in the corner. Researchers have found that using the tool without caution can expose your sensitive date to hackers. So, if you have been pasting URLs into ChatGPT stop till you read this.
But amidst this, come meet Mojo…again. Yes, we have covered Mojo before but this newish kid on the block is rewriting the rules for the AI era. With a syntax that plays nice with Python, Mojo zooms at speeds up to 35,000 times faster, especially when it comes to nerdy neural network stuff. Meanwhile, Seth Larson, PSF’s Security Developer-in-Residence, has built a time machine for you to snoop around language trends and see what Python builders have been up to since 2005.
But that's not all – we've got a fresh batch of tutorials and tricks and here are my top 5 picks:
And as always, we have exclusive tutorial from the Exploratory Data Analysis with Python Cookbook that will teach you how to perform Automated Exploratory Data Analysis (EDA) using the pandas profiling library in Python, exploring various options for customization and optimization in today’s Expert Insight section. So dive right in!
Stay awesome!
Divya Anne Selvaraj
Editor-in-Chief
P.S.: If you want us to find a tutorial for you the next time or give us any feedback, take the survey and as a thank you, you can download a free e-book of the Expert Python Programming book.
🐍 Python in the Tech 💻 Jungle 🌳

🗞️News
ChatGPT's Python code writer has a major security hole that could let hackers steal your data: Exercise caution when pasting URLs into the generative AI tool. By exploiting instructions embedded in a web page, hackers could command ChatGPT to extract sensitive data, such as API keys and passwords, stored in the virtual machine. Read for a full analysis and to mitigate this security concern.
Revamping Python for an AI World with Mojo: With a syntax familiar to Python users, Mojo can run up to 35,000 times faster, excelling in matrix multiplications crucial for neural networks. Read to learn more about how Mojo which aims to be a Python superset with features like auto-tuning and optional static typing.
Python Package Insights – Querying Trends and Wheel Builders Since 2005: In this article Seth Larson takes you through an exercise of querying Python Package Index files since 2005, using a dataset to analyze memory-safe language adoption. Read to discover a utility for querying Python Package Index files, facilitating insightful analysis of language trends and wheel builder popularity.
💼Case Studies and Experiments🔬
Deobfuscating World of Warships' Python Scripts: This article describes an interesting project, wows deob, that navigates the complexities of deobfuscating World of Warships' Python scripts, while dissecting Python VM usage, and referencing past deobfuscation efforts. Read for insights into potential improvements in the decompilation process and scripting intricacies.
Simplifying Python workflows with sitecustomize.py: This case study explores how Alan, a digital health insurance company in Europe, with a Python backend using Flask, streamlines its workflows by leveraging the sitecustomize.py script for tasks like executing code at startup, checking dependencies, and auto-loading the Flask app context. Read for practical insights into optimizing Python development environments.
📊Analysis
The Changing “Guarantees” Given by Python's Global Interpreter Lock: This article dissects GIL changes from Python 3.9 to3.13, revealing subtle shifts in atomicity guarantees. Read to learn how the latest development, seemingly aimed at enhancing single-threaded performance, raises concerns for code relying on older semantics.
Why ChatGPT performs better on Julia than Python (and R) for LLM Code Generation: This comparative study reveals that 81.5% of generated Julia code executes successfully, surpassing Python's performance. Read to learn the reasons why, including how Python's syntax inconsistencies and lack of standardization create stumbling blocks for ChatGPT.
The 6 best ORMs for database-powered Python apps: This article explores the key features and nuances of SQLAlchemy, PonyORM, Django ORM, Peewee, SQLObject, and Tortoise ORM. Read to make informed choices for your apps.
The 7 best Python libraries for parallel processing: Want to move beyond the limitations of Python's default single-threaded implementation, CPython? Read to learn how Ray, Dask, Dispy, Pandaral·lel, Ipyparallel, Joblib, and Parsl, specialize in parallelizing tasks across CPUs, machines, or both and gain actionable insights.
🎓 Tutorials and Guides 🤓

Building a Python compiler and interpreter with Booleans: This tutorial will teach you how to incorporate Boolean literals (True and False)and the unary Boolean operator "not" into a Python compiler and interpreter, emphasizing simplification through the introduction of a general Constant tree node. Read to enhance your understanding of compiler development and Boolean operations.
Harnessing Python's efficiency through concise One-Liners: Ever wondered how to reverse a string, check if a number is even, or find the intersection of two lists in just one line of Python code? If yes, read this post for a list of one-liners that will let you do this and more from removing duplicates to palindromic checks.
Refactoring Test Suites for Improved Test Parametrization in Python: This exercise with a solution will teach you how to create a single test function that tests multiple cases. Read to learn about an easy way to identify and handle failures without stopping the execution of other test cases and for examples using the parametrize decorator in pytest and the subTest context manager in unittest.
Embeddings and Vector Databases With ChromaDB: Ever wondered how large language models (LLMs) like ChatGPT handle topics beyond their training data? The answer lies in vector databases like ChromaDB. Read for a tutorial that will teach you to harness the power of representing unstructured data as vectors, using embeddings, and leveraging ChromaDB for efficient storage and retrieval.
7 Essential Data Quality Checks with Pandas: The tutorial covers essential data quality checks including missing values, duplicate records, data types, outliers, numeric ranges, and more, using the California Housing Dataset from scikit-learn. Read if you are getting started in data science and using pandas for analysis.
Python for Science and Engineering by Hans-Petter Halvorsen: This textbook introduces Python with a focus on science and engineering applications. Read if you are looking for an in-depth guide including examples, exercises, and practical applications.
🔑 Best Practices and Code Optimization 🔏

Running Python Parallel Applications with Sub Interpreters: This article explores sub interpreter usage, performance benchmarks, data sharing mechanisms, and potential application in web servers like Gunicorn, indicating promising results with FastAPI and Flask. Read if you are interested in optimizing parallel code execution.
Using argparse in my Python programs encourages me to add options to them: This article explores the advantages of using argparse in Python programs, highlighting streamlined option handling, easy integration of new features, and the efficiency gained in code modification. Read to learn how this shift simplifies code modification and enhances overall programming experience.
NumPy for Numpties: This article sets the tone for a series of future articles, aiming to demystify NumPy, and starts off with a NumPy magic trick—creating a disc, a two-dimensional visual representation created using NumPy and Matplotlib using Python code. Read for a break down of the code, highlighting NumPy and Matplotlib usage.
An Interview with Paul of Grist - a modern relational spreadsheet with Python support: You may find this interesting if you are looking for a modern open-source solution that combines a relational database, a Python-based data engine, and a node server, for collaborative data projects with granular access control. Read to discover innovative and flexible spreadsheet functionalities.
SQLAlchemy relationship loading techniques: This is a quick summary of SQLAlchemy relationship loading techniques, focusing on the difference between lazy loading methods. Read for code examples showcasing different SQLAlchemy relationship loading techniques, including lazyload, joinedload, subqueryload, and more, and how each influences the loading of related data such as user baskets.
Optimizing Data Workflow – Integrating Data Science with PDF Tools: This article highlights the importance of extracting, merging, and compressing PDFs using automation and Python libraries for streamlined processes. Read to learn how Python libraries such as PyPDF2, PyPDFMerger, and PyMuPDF can be used to optimize your data workflows.
🧠 Expert insight 📚

Here’s an excerpt from “Chapter 10, Performing Automated Exploratory Data Analysis in Python” in the Exploratory Data Analysis with Python Cookbook
by Ayodele Oluleye.
Doing Automated EDA using pandas profiling
pandas profiling is a popular Automated EDA library that generates EDA reports from a dataset stored in a pandas dataframe. With a line of code, the library can generate a detailed report, which covers critical information such as
summary statistics, distribution of variables, correlation/interaction between variables, and missing values.
The library is useful for quickly and easily generating insights from large datasets because it requires minimal effort from its users. The output is presented in an interactive HTML report, which can easily be customized. The Automated EDA report generated by pandas profiling contains the following sections:
Overview: This section provides a general summary of the dataset. It includes the number of observations, the number of variables, missing values, duplicate rows, and more.
Variables: This section provides information about the variables in the dataset. It includes summary statistics (mean, median, standard deviation, and distinct values), data type, missing values, and more. It also has a subsection that provides histograms, common values, and extreme values.
Correlations: This section provides a correlation matrix using a heatmap to highlight the relationship between all the variables in the dataset.
Interactions: This section shows the bivariate analysis between variable pairs in the dataset. It uses scatterplots, density plots, and other visualizations to perform this. Users can switch between variables at the click of a button.
Missing values: This section highlights the number and percentage of missing values that exist in each variable. It also provides information using a matrix, heatmap, and dendrogram.
Sample: This section provides a sample of the dataset containing the first 10 and last 10 rows.
The following are some customizations we can achieve in pandas profiling:
We can use the minimal configuration parameter to exclude expensive computations such as correlations or interactions between variables. This is very useful when working with large datasets.
We can provide additional metadata or information about our dataset and its variables so that this is also displayed under the overview section. This is critical if we plan to share the report with the public or a team.
We can store the profile report as an HTML file using the to_file method.
In this recipe, we will explore using the ProfileReport class in the ydata_profiling library to generate an Automated EDA report. The Pandas_profiling library has been renamed to ydata_profiling. However, it is still popularly known as the former.
Getting ready
We will work with only one dataset in this chapter: Customer Personality Analysis data from Kaggle.
Create a folder specifically for this chapter. Within this folder, create a new Python script or Jupyter Notebook file and create a subfolder called data. In the subfolder, place the marketing_campaign.csv file.
Alternatively, you could obtain all the necessary files from the GitHub repository.
Note
Kaggle provides the Customer Personality Analysis data for public use at https://www.kaggle.com/datasets/imakash3011/customer-personality-analysis.
In this chapter, we will use the full dataset for the different recipes. The data is also available in the repository for this book.
How to do it…
We will learn how to perform automated EDA using the pandas and ydata_profiling libraries:
Import the pandas and ydata_profiling libraries:
import pandas as pd
from ydata_profiling import ProfileReport
Load the .csv into a dataframe using read_csv:
marketing_data = pd.read_csv("data/marketing_campaign.csv")
Create an Automated EDA report using the ProfileReport class in the ydata_profiling library. Use the to_file method to output the report to an HTML file:
profile = ProfileReport(marketing_data)
profile.to_file("Reports/profile_output.html")
This results in the following output:
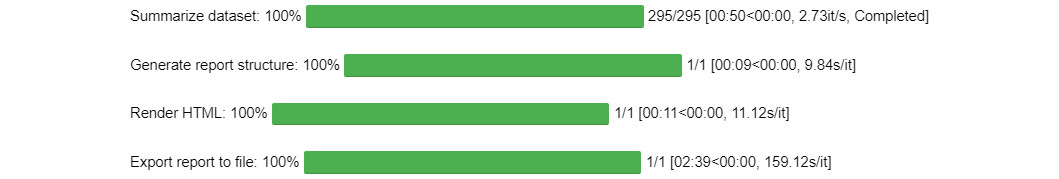
Figure 10.1: The Pandas Profiling Report progress bar
Open the HTML output file in the Reports directory and view the report’s Overview section:
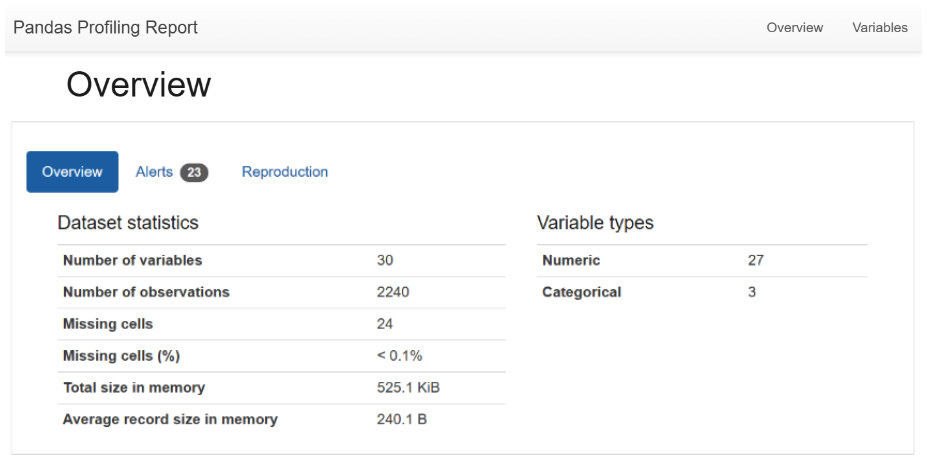
Figure 10.2: Pandas Profiling Report Overview
View the report’s Variables section.
View the variable Interactions section
View the Correlations section.
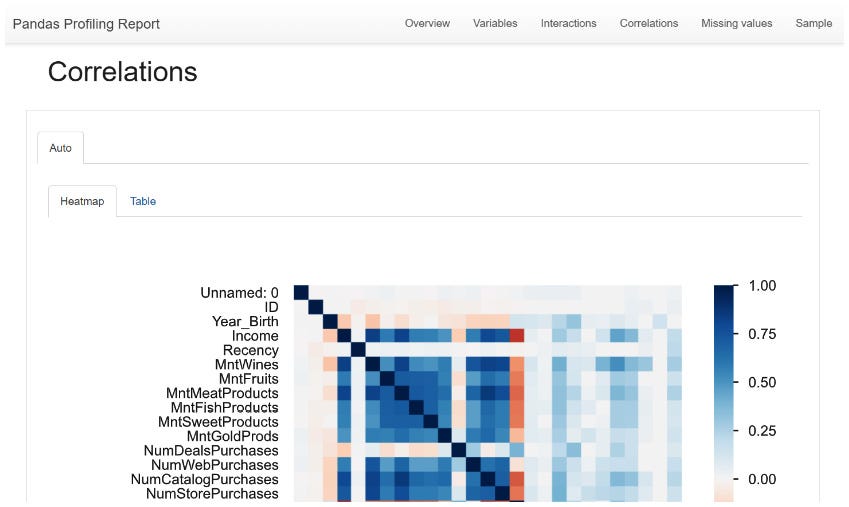
Figure 10.5: Pandas Profiling Report Correlations
View the Missing values section.
Create an Automated EDA report with the minimal configuration parameter to exclude expensive computations such as correlations or interactions between variables:
profile_min = ProfileReport(marketing_data, minimal=True)
profile_min.to_file("Reports/profile_minimal_output.html")
Open the HTML output file in the Reports directory and view the report’s Overview section.
Create an Automated EDA report with additional metadata or information about our dataset and its variables:
profile_meta = ProfileReport(
marketing_data,
title="Customer Personality Analysis Data",
dataset={
"description": "This data contains marketing and sales data of a company's customers. It is useful for identifying the most ideal customers to target.",
"url": "https://www.kaggle.com/datasets/imakash3011/customer-personality-analysis.",
},
variables= {
"descriptions": {
"ID": "Customer's unique identifier",
"Year_Birth": "Customer's birth year",
"Education": "Customer's education level",
… … … … …
"MntSweetProducts": "Amount spent on sweets in last 2 years",
}
}
)
profile_meta.to_file("Reports/profile_with_metadata.html")
Open the HTML output file in the Reports directory and view the report’s Overview and Variables pages.
Great. We just performed Automated EDA on our dataset using pandas profiling.
How it works...
In this recipe, we use the pandas and ydata_profiling libraries. In step 1, we import these libraries. In step 2, we load the Customer Personality Analysis data using the read_csv method.
In step 3, we use the ProfileReport class in ydata_profiling to generate an Automated EDA report on our data. We also use the to_file method to export the report to an HTML file in the Reports folder in our active directory. In step 4, we open profile_output.html in the Reports folder and view the report’s Overview section. The section contains tabs that cover summary statistics about our data and alert on some issues with the data, such as missing values, zero values, unique values, and more. Lastly, it contains a Reproduction tab that covers information about the report generation. At the top right of the page, we can see tabs for all the sections available in the report (Overview, Variables, Interactions, Correlations, and more); we can navigate to each section by clicking on the relevant tab or scrolling down the report.
In step 5, we go to the Variables section, which contains summary statistics of each variable. In step 6, we view the variable Interactions section, which shows the relationships between our numerical variables. We can select variables on the left and right pane to view various interactions. In step 7, we view the Correlations section, which quantifies the relationship between variables. This section provides a Heatmap tab and a Table tab to display the correlation.
In step 8, we view the Missing values section. This shows the number of missing values within all variables. It provides this information in either a bar chart or a matrix chart.
In steps 9 and 10, we use the ProfileReport class again to generate an Automated EDA report with minimal information. For the minimal parameter, we specify the value as True and then export the report to an HTML file using the to_file method. We then open profile_minimal_output.html in the Reports folder and view the report’s Overview section. At the top right of the page, we can see only two tabs available in the report (Overview and Variables). The minimal configuration is useful when working with very large datasets, and there is a need to exclude expensive computations such as correlations or interactions between variables.
In step 11, we use the ProfileReport class again to generate an Automated EDA report with the metadata of our dataset. We provide the dataset title in the title parameter; we provide the description of the dataset as a dictionary in the dataset parameter, and we provide the variable descriptions as another dictionary in the variables parameter. In step 12, we view the report. The report now has a Dataset and Variables subtab under the Overview section. These tabs display the metadata of our dataset.
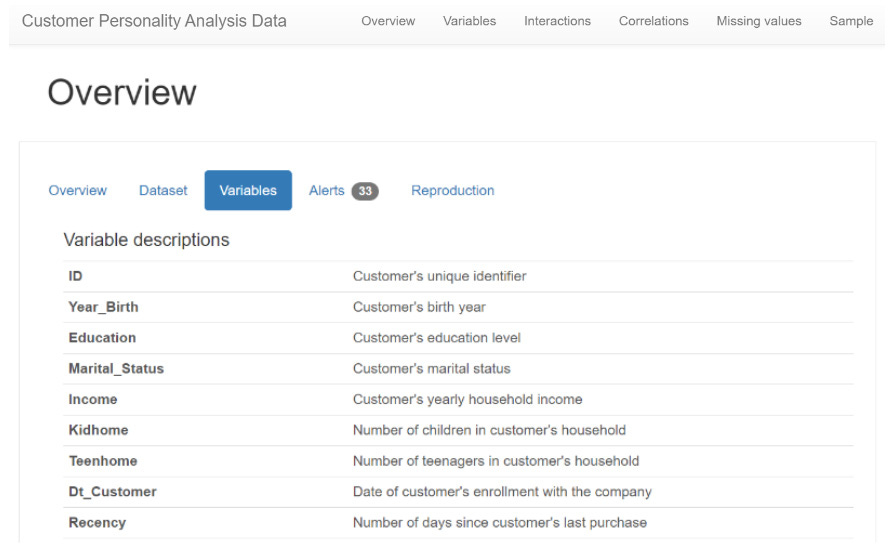
Figure 10.11: Pandas Profiling Report Variables tab with metadata
See also…
You can check out these useful resources on pandas profiling:
https://pub.towardsai.net/advanced-eda-made-simple-using-pandas-profiling-35f83027061a
https://ydata-profiling.ydata.ai/docs/master/pages/advanced_usage/available_settings.html
Exploratory Data Analysis with Python Cookbook by Ayodele Oluleye was published in June 2023. You can read the first chapter for free and buy the book here. If you are a Packt subscriber, you can start reading right away here.
And that’s a wrap.
We have an entire range of newsletters with focused content for tech pros. Subscribe to the ones you find the most useful here. The complete PythonPro archives can be found here.
If you have any feedback, leave your comments below!
See you next week!