PythonPro #8: 🚀Supercharge Data Viz with Plotly, Kickstart Machine Learning, and Troubleshoot with Copilot👩✈️
“In the face of ambiguity, refuse the temptation to guess.”
— Tim Peters (2004), The Zen of Python
Welcome to a brand new issue of PythonPro!
Highlights: Today we are looking at how someone started a business by churning out 1,000 articles in an hour with GPT-4. You can do it too in 79 lines of Python, but there may be consequences from the Gods at Google. We are also shedding light on MIT's PockEngine which promises to speed up on-device learning by 15x. And in our case study for this week we dive into Pythonic design in a Library Catalog.
We've also got a fresh batch of tutorials and tricks and here are my top 5 picks:
📈Elevate Your Python Data Visualization Skills with Advanced Plotly Techniques and Code Examples
Troubleshooting Python Errors in Jupyter Notebooks with GitHub Copilot👩✈️
🛡️5 Python Libraries Every Cybersecurity Professional Must Know
And as always, in today’s Expert Insight we have an exclusive excerpt from the book Hands-On Web Scraping with Python - Second Edition, that will teach you how to use pandas and plotly for data analysis and visualization using a practical example. So dive right in!
Stay awesome!
Divya Anne Selvaraj
Editor-in-Chief
P.S.: If you want us to find a tutorial for you the next time or give us any feedback, take the survey and as a thank you, you can download a free e-book of Interactive Data Visualization with Python - 2nd Ed..
🐍 Python in the Tech 💻 Jungle 🌳
🗞️News
How to build an automated content empire in 79 lines of Python: Last week someone used a simple Python script, fueled by OpenAI's GPT-4, to hijack a competitor's content structure and create 1,000 articles in an hour and then put the service on sale. Read to learn how you can do this too, at a fraction of the cost, but there may be consequences 🤷.
Python routes and quality of life improvements in Primate (a polymorphic development platform) Release 0.27: This preview release introduces upgrades, including dots in route names, custom headers in view handlers, and async guards. Read to learn how to integrate Python on the backend seamlessly with frontend frameworks like Svelte and React.
PockEngine: Efficient On-Device Learning for Edge Devices: Popular deep learning frameworks like PyTorch incur significant memory overhead and runtime slowness on low-frequency CPUs, such as ARM Cortex. Read to learn how this MIT-developed approach aims to mitigate these issues by minimizing reliance on host languages like Python, addresses privacy and energy concerns within cloud-based updates, and achieves up to a 15x speedup in on-device training.
💼Case Studies and Experiments🔬
An Object-Oriented Design Case Study in Library Catalog Systems: This case study navigates the design complexities of an object-oriented library catalog system, exploring considerations for diverse items, introducing inheritance, and later opting for a composition-based approach for enhanced flexibility. Read to explore the nuances of inheritance and composition.
Python OpenCV & ESP32 Cam based DIY Security Surveillance Camera: This DIY guide accompanied by a video tutorial will take you through landmark detection, pose tracking, Arduino integration, and buzzer activation for real-world machine learning applications. Read for insights into building a real-world computer vision application with pose landmark detection and image processing with Python.
How many Python core devs use typing?: This case study examines the usage of type annotations among 190 Python core developers to uncover prevalence and trends in adopting type annotations. Read for a a data-driven perspective on how developers are incorporating this feature into their projects.
📊Analysis
Python, Vue, Chinese-LLaMA-2 and The Three-Body Problem: This article explores the convergence of the Three-Body Problem, Chinese language, and AI through experiments, translations, CUDA simulations, and more. Read to discover a program using CuPy for n-body simulations, and reflect on Python's involvement in AI and LLMs for a nuanced perspective on AI's impact on technology, and society.
5 Python Libraries Every Cybersecurity Professional Must Know: This short article explores crucial Python libraries for HTTP handling, network packet analysis, cryptography, network scanning, and malware detection. Read to discover essential Python libraries that can streamline your cybersecurity tasks.
Python is Easy. Go is Simple. Simple != Easy: This article advocates a pragmatic approach where Python serves as a prototyping ground, and Go takes over for robust, scalable applications. Read to learn how this symbiotic relationship can enhance your development efficiency and maintain clarity in codebases.
🎓 Tutorials and Guides 🤓
Elevate Your Python Data Visualization Skills: A Deep Dive into Advanced Plotly Techniques with Practical Code Examples: This comprehensive guide covers topics such as basic line plots, scatter plots with color gradients, heatmaps with annotations, radar charts, and lots more. Read to harness Plotly to create interactive and visually appealing plots and enhance your data visualization skills.
Machine Learning with Python and Scikit-Learn: This hands-on free to access, 18-hour Machine Learning course, led by Aakash N S, CEO of Jovian, is tailored for Python and statistics beginners. Watch if you want to gain confidence in building, training, and deploying real-world machine learning models. Learn more here.
Troubleshooting Python Errors in Jupyter Notebooks with GitHub Copilot: This explainer will help you resolve common Python errors, using VSCode and GitHub Copilot, related to indentation, module imports, and variable names. Read if you are an AI engineer or data scientist and are looking for practical tips to streamline your workflow in data exploration and modeling experiments.
Functional Data Engineering with Python and Airflow: This tutorial will teach you how to seamlessly transition your data pipeline to a functional approach in just two steps. Read to learn how to tackle dashboard reproducibility and immutable data challenges for enhanced data analysis.
Simplifying Microservices Development with Python FastAPI and Polylith Architecture: This guide will help you build modern, scalable microservices with a focus on simplicity, code reuse, and efficient development practices. Read for a step-by-step guide to building a CRUD service for handling messages, leveraging Polylith's optional tooling support for seamless code structuring.
Building a small REPL in Python: This concise step-by-step guide will help you leverage Python's built-in features to construct a REPL for a new content-addressable language, covering aspects such as programmatic control, customization for the specific language. Read to learn how to add line editing support, history, and the exciting addition of tab completion.
🔑 Best Practices and Code Optimization 🔏
Python, Asyncio and Footguns: This article delves into potential pitfalls with asyncio.Lock() in Python, exposing a footgun 🔫 that can lead to sporadic errors under load. Read if you are using a version below Python 3.10 to safeguard your code's concurrency sanity.
Python CloudScraper to Scrape Cloudflare Protected Websites: This comprehensive guide introduces a Python library designed to bypass Cloudflare covering installation, usage, customization, integration with proxies and more. Read to overcome Cloudflare's anti-bot measures and optimize your scraping strategies.
Caching in Python: This tutorial explores caching strategies for optimizing code, focusing on Pydantic models and their compatibility with caching. Read to learn about in-memory caching using functools.cache, persistent large data caching with diskcache, and a Redis caching decorator for distributed systems, and find versatile solutions for improved performance in various application scenarios.
Programming with Data Parallel Extensions for Python: This article introduces dpnp, numba-dpex, and dpctl along with their SYCL-based implementation and practical examples for GPU execution. Read to harness the computational power of GPUs and other accelerators, and optimize your numerical Python code for enhanced performance across a variety of devices.
Understanding Python re(gex)?: This article delves into essential aspects of the Python re module, covering re.search(), re.sub(), and the compilation of regular expressions. Read for insights into conditional expression usage and byte data handling and to enhance your regex skills through hands-on experimentation.
CPython Object System Internals: Understanding the Role of PyObject: This article explores how CPython achieves polymorphism and inheritance through struct embedding, focusing on the central role of PyObject. Read for a foundational understanding and discover a trick to simplify complex implementations.
Fleet Context for Efficient Library Queries and Embeddings: This Python tool simplifies library queries and embeddings, offering smart re-ranking, metadata optimization, and CLI flexibility for an enhanced workflow experience. Read to download pre-computed embedding vectors, conveniently available as Parquet files, either from S3 or through a customized Python CLI tool.
🧠 Expert insight 📚
Here’s an excerpt from “Chapter 10, Data Mining, Analysis, and Visualization” in the book Hands-On Web Scraping with Python - Second Edition by Anish Chapagain.
Data analysis and visualization with pandas and plotly
pandas is one of the most widely used data analysis libraries. Performance, data structure (series, DataFrames), ease of use, convertibility, input-output compatibility, availability of features, and many other things keep pandas at the top of its
category
plotly, on the other hand, is a graphing library. It contains some advanced imaging features such as downloading images in .png format, zooming in and out, auto-scaling, pan clicking and dragging, resetting axes, and more. These plotly features are available in the top right-hand corner of visualizations without using code.
pandas can be used with various graphing libraries, such as matplotlib and seaborn. The plot() method from pandas can be used directly on top of data. pandas also provides options to choose graphing libraries and apply them as required in code or notebooks. For example, pd.options.plotting.backend = "plotly" sets pandas’ plotting library to plotly:
import pandas as pd
import numpy as np
import plotly.express as px
pd.options.plotting.backend = "plotly"
Since Jupyter notebooks are used in code examples, we will find the preceding code at the top of the notebook. This code can also be called or imported in the required places.
Let’s explore some basic usage of pandas and analyze data through some examples.
Example 1 – book analysis
The code for this example is available at data_analysis_book.ipynb.
The read_json() method reads the JSON file and creates a DataFrame called books. The shape attribute returns a tuple object where the first value is the number of rows and the last value is the number of columns. describe() displays statistical details about the numerical columns. The include="all" argument in describe() provides the statistical detail of all available columns or those returned from books.columns:
books = pd.read_json("book_details.json")
books.shape # (29, 8)
books.describe()
books.describe(include="all")
books.info
books.columns
Index(['Upc', 'Title', 'Price', 'Rating', 'Stock', 'Stock_Qty', 'Url', 'Image'], dtype='object')
Column names can be used as attributes, such as books.Title, or in indexed format, such as books['Title']. Python supports indexing in [START: STOP: STEP] syntax. In books.Title[::3], every third book title is provided:
books.Title[::3] # no start an stop, only step
0 Birdsong: A Story in Pictures
3 The White Cat and the Monk: A Retelling of the...
…….
24 Counting Thyme
27 Matilda
Name: Title, dtype: object
There are various methods and attributes in pandas for accessing row data. The most common one is index and location, or iloc[]:
books.iloc[2] # returns row from index 3 (0,1,2)
Upc b5ea0b5dabed25a8
Title The Secret of Dreadwillow Carse
………
Url http://books.toscrape.com/catalogue/the-secret...
Image http://books.toscrape.com/media/cache/c4/a2/c4...
Name: 2, dtype: object
Checking unique values and counting the total number of unique values is quite applicable during analysis. Here, books has 29 rows, but there are only 5 unique values (nuinque() returns the number of unique elements). This suggests that duplicate values exist in the Rating column. Rating values are strings, which might cause problems if any statistical computation is required. Therefore, cleaning is required for the Rating column:
books["Rating"].unique()
# array(['Three','One','Four','Five', 'Two'], dtype=object)
books["Rating"].nunique() # 5
One of the important aspects of using pandas is data filtering. Various methods can be used for filtering, such as filter(), where(), and query(). Also, as shown in the preceding code, logical operations (such as and and or) can be used for filtering. [['Title', 'Price', 'Stock_Qty']], after the query() operation, collects and displays results from only the three columns mentioned:
books.query("Stock_Qty >= 15 and Title.str.contains('Bear')") [['Title', 'Price', 'Stock_Qty']]
Similar to the str.contains() method, there are also startswith() and endswith() methods. These methods play crucial roles when dealing with string types, and again when filtering techniques are applied.
As shown in the preceding code, the value_counts() method counts the total number of occurrences of the provided value for the selected columns:
ratingCount = books["Rating"].value_counts()
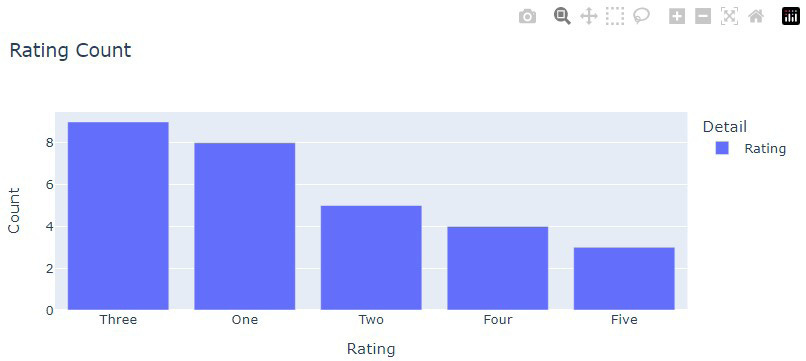
The ratingCount variable contains the counts related to book rating and plots the bar chart, as shown in the following code:
ratingCount.plot.bar(title="Rating Count", labels=dict(index="Rating", value="Count", variable="Detail"))
plotly support various types of chart, such as bar, line, barh, and pie.
Figure 10.8: Using a plotly bar chart
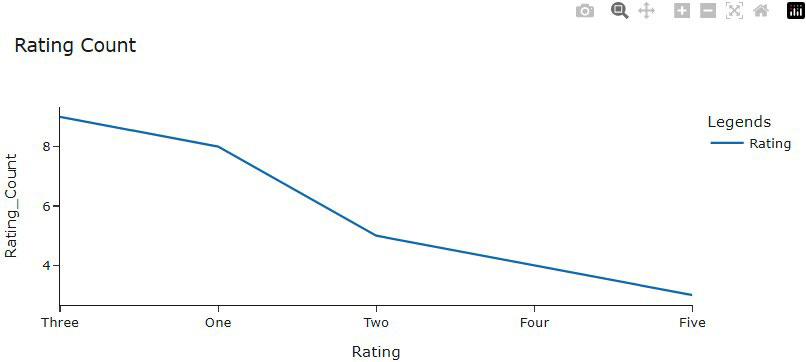
The following code plots a default plot, which is a line chart, with the labels provided:
ratingCount.plot(title="Rating Count", template="simple_white", labels=dict(index="Rating", value="Rating_Count", variable="Legends"))
If no type is mentioned, plotly will draw a line chart, as shown in Figure 10.9:
Figure 10.9: Line chart (ratingCount)
The pandas copy() method creates a duplicate DataFrame. Duplication is necessary in this case because we are going to clean some column values. The inplace=True argument is quite sensitive because it makes changes to the bookDF DataFrame:
bookDF = books.copy() # Duplicating a DataFrame
bookDF["Rating"].replace(["One","Two","Three","Four",
"Five"],[1,2,3,4,5],inplace=True)
bookDF["Price"] = bookDF["Price"].str.replace("£","")
bookDF["Price"] = bookDF.Price.astype(float)
bookDF is clean and now has Price, which is a float, and Rating, which is an integer. The groupby() method groups or combines the Price values for each Rating and sums the Price values using np.sum:
price_groupby=bookDF.groupby("Rating")["Price"].agg(np.sum)
price_groupby.plot.bar()
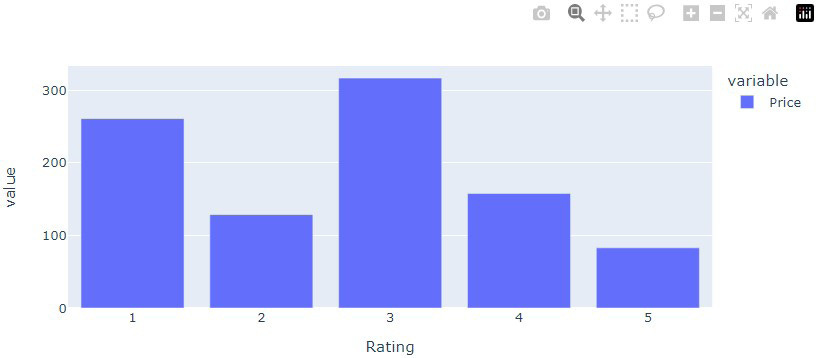
The result of the preceding code has been plotted as a bar chart, as shown in Figure 10.10:
Figure 10.10: Aggregated price for each rating
As shown in Figure 10.10, we can determine the following based on the Rating number (from client feedback) values:
Books with Rating values of 3 and 1 are the top two sellers
Books with a Rating value of 5 are the lowest sellers
Finally, the DataFrame with clean data, bookDF, was written to a new CSV file using to_csv(). In addition, EDA was conducted using the book_details_clean.csv file:
bookDF.to_csv('book_details_clean.csv', index=False)
Important note
EDA HTML report files with both uncleaned and cleaned data are available as reports. It is recommended to view both reports and see the difference in details they carry.
The contents of the book_details_clean.csv file were cleaned and processed and then used in the code.
Hands-On Web Scraping with Python - Second Edition by Anish Chapagain
was published in June 2023. You can read the first chapter for free and buy the book here. If you are a Packt subscriber, you can continue reading right away here.
And that’s a wrap.
We have an entire range of newsletters with focused content for tech pros. Subscribe to the ones you find the most useful here. The complete PythonPro archives can be found here.
If you have any comments or feedback, take the survey or leave your thoughts below!
See you next week!


